Towards virtual ‘touching out’: GPS-based network matching
Leveraging timestamped GPS location data from devices - how Dynamic Time Warping algorithm can identify the service a rider is travelling on.
14th Mar 2017

The ability to accurately track passenger journeys is a prerequisite of advanced transport services and analytical applications, ranging from estimating bus occupancy factors to account-based ticketing. This is easy enough with dedicated hardware infrastructure, such as onboard smart-card readers, where passengers ‘touch in’ and ‘touch out’, but it isn’t cheap. Savvy operators are looking for innovative ways to achieve the same end, without investing significantly in the purchase and maintenance of yet more hardware.
At Passenger we have taken a different approach by leveraging timestamped GPS location data from the mobile phones of passengers. While the ‘touch in’ event is relatively easy to identify using a set of simple rules, e.g. displaying the ticket on the phone in a vicinity of a bus stop, virtual ‘touch out’ events are much more challenging, and hence require some smart engineering and machine learning to be flagged correctly. Our approach is based on first identifying the bus service the passenger is travelling on and then waiting for the trajectories of the bus and passenger to diverge. Solving this “network matching” problem also unlocks other applications like for example smart advertising.
There are many possible approaches to tackle this problem, and one of them is called Dynamic Time Warping (DTW). This algorithm tries to align two sequences of points of the same or not-very-different lengths. DTW has been applied in many fields such as medicine, speech recognition, the study of earthquakes, and fitness wearables. In our case, the algorithm is used to compare a given GPS trace to every possible bus route and then select the closest match, according to DTW distance measure. Python code for DTW is available in our repository.
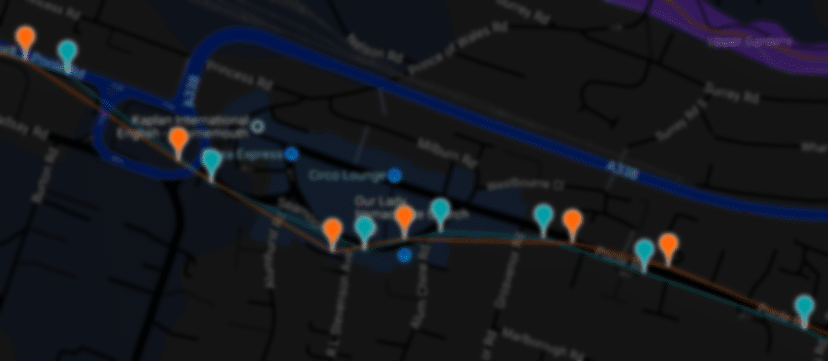
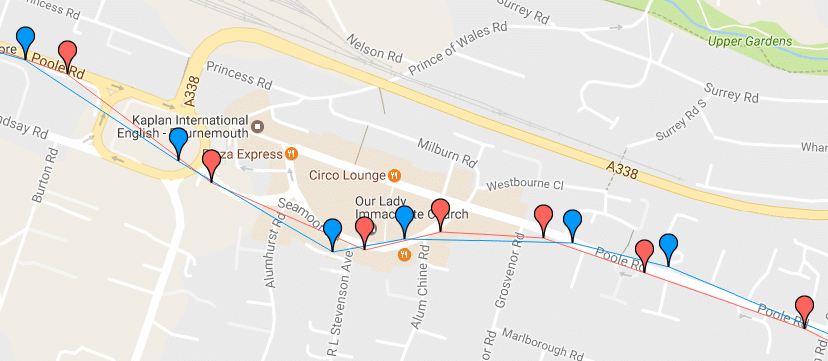
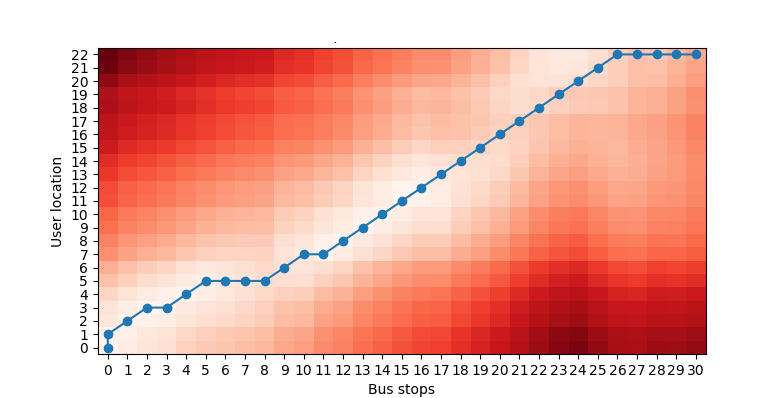
One of the results is shown below. On the map, red markers represent bus stops, while blue markers are user GPS locations. The matrix below the map represents the match between these two sequences. For example, in the bottom left corner, it can be seen that the first two user locations match the first bus stop. This may mean that the bus was stationary for a couple of minutes before departing.
One of the problems we found is that DTW doesn’t work well if sequences have very different lengths and, unfortunately, this is a common case in our data. A bus route can have tens of stops, but the trace of a user could only cover a few of them. Thus, we need to “crop” the longer sequence before applying DTW.
We found that this approach is relatively fast (it takes less than a second to match one journey), but the execution time of this algorithm depends on the length of sequences and the number of bus routes in the network. By pre-selecting the possible bus routes in a bounding box delimited by user GPS coordinates, we can speed up the matching process and directly deploy this virtual ‘touch out’ to mobile phones.
Our data science team is developing approaches to make this detection faster and even more accurate. If you are interested in this technology and would like to know more, please get in touch.

Newsletter
We care about protecting your data. Here’s our Privacy Policy.
Related news
30th Nov 2022
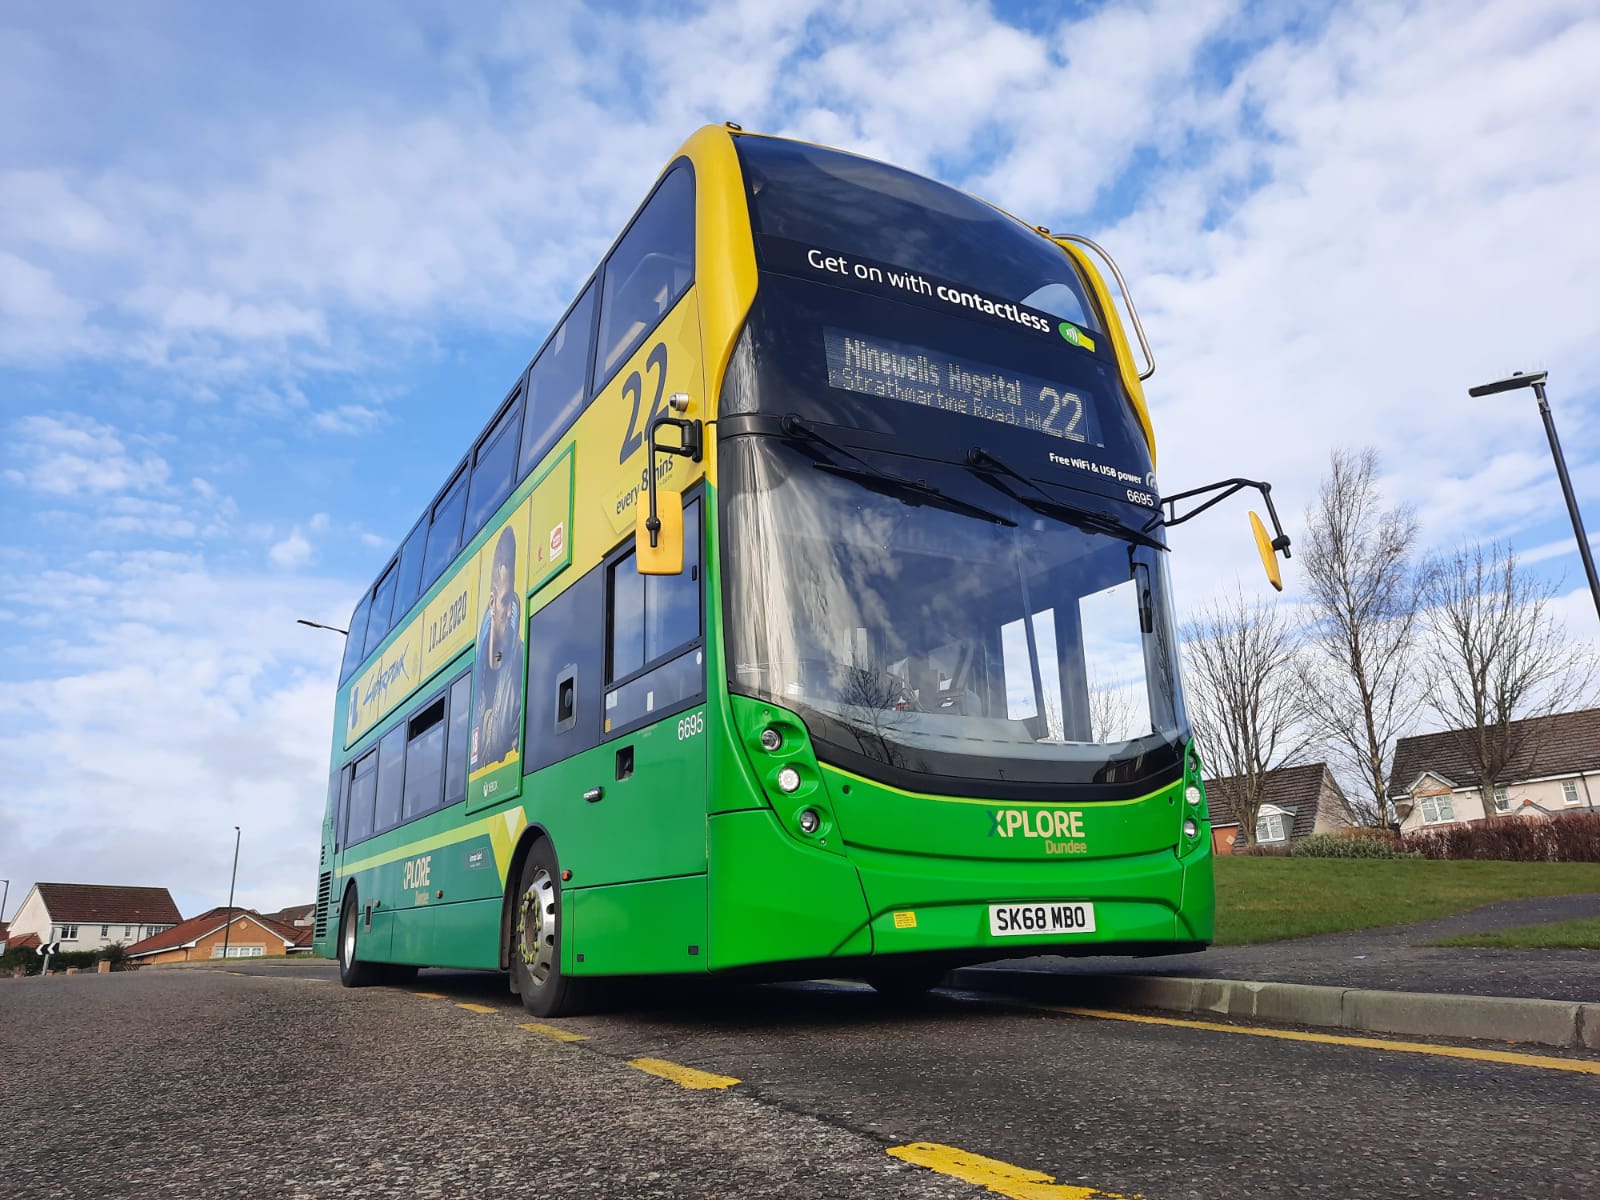
Xplore Dundee steps up contactless customer experience
Xplore Dundee has successfully gone live with Passenger’s Contactless Journeys capability, supporting the launch of contactless daily capping.

23rd Dec 2022
2022 in review
It has been a rollercoaster of a year in so many ways, but as 2022 comes to a close we wanted to look back at all the good stuff we’ve collaborated on and delivered hand in hand with the bus industry and our partners.

Start your journey with Passenger
If you want to learn more, request a demo or talk to someone who can help you take the next step forwards, just drop us a line.
